Where homeownership is most and least prevalent in the U.S.
While current rent prices and recent home transaction data can offer insights into the trajectory of a community’s housing market, these snapshots don’t necessarily capture the financial realities of residents who already exist in the market. A household’s experience can vary widely depending on when they entered the housing market, how their ongoing costs compare relative to the local rental market, and other factors like tax assessments and job market conditions. These differences can shape the long-term value of homeownership across communities. Moreover, the local homeownership rates may also have implications for hopeful first-time homeowners and have broader implications on the local culture, values, and the area’s tax base over time.
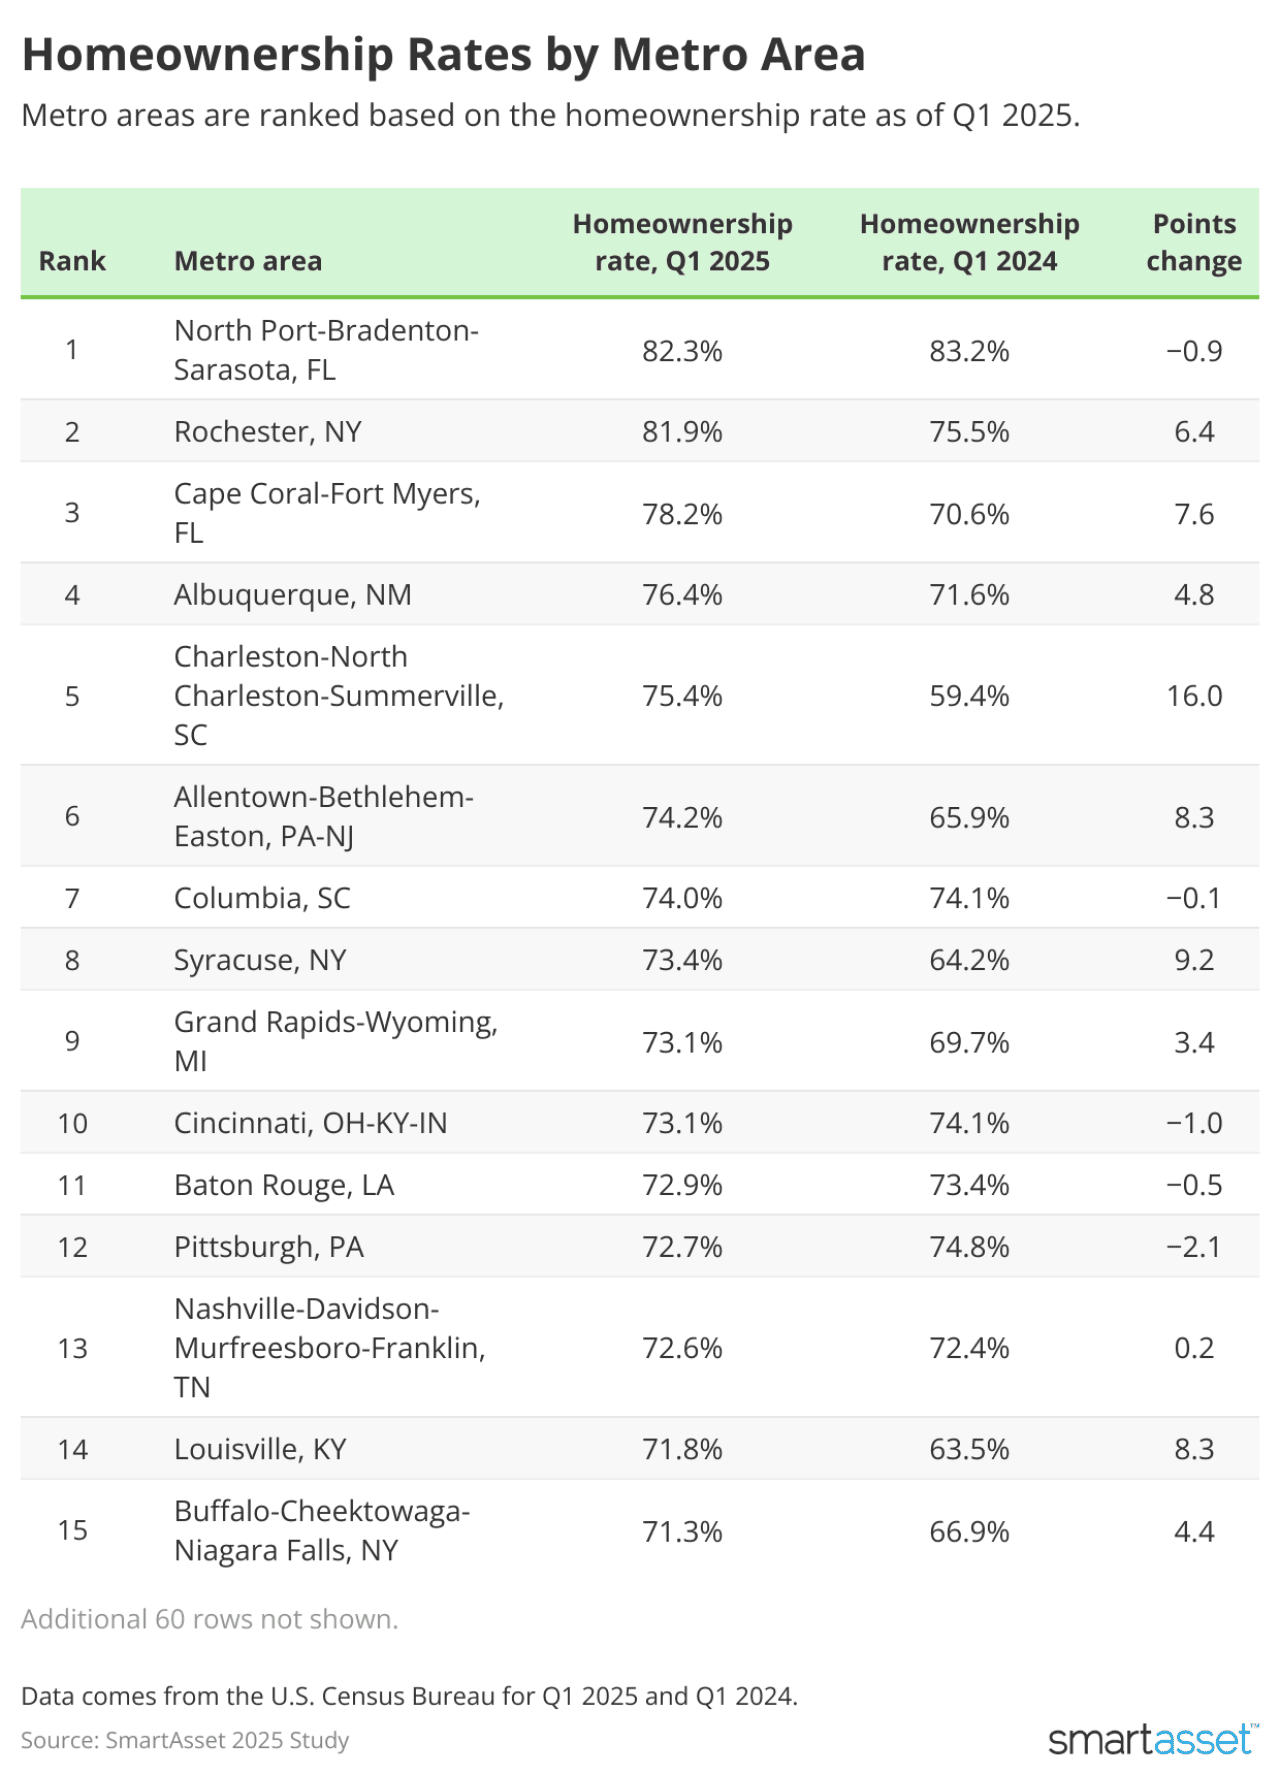
With this in mind, SmartAsset ranked 75 U.S. metro areas based on the rate of homeownership to better understand where residents intend to stay and invest — and changes in these metrics to help describe changing trends.
Key Findings
In these two metro areas, more than 80% of residents are homeowners. The North Port-Bradenton-Sarasota, FL area has the highest homeownership rate at 82.3%, despite a 0.9 point decline from last year. The Rochester, NY metro ranks second with a homeownership rate of 81.9%, up from 75.5% just a year ago.
The New York City metro area has the lowest homeownership rates nationwide, with just 47% of residents owning a home. With At just 47% of rate of homeownership, the New York City metro has a typical home value of $685,225. Other notoriously expensive metros also have some of the lowest rates of homeownership rates, including the San Francisco and Los Angeles metros which are tied for the second-lowest homeownership rate at 49%.
The homeownership rate surged most year over year in the Charleston, SC metro. The homeownership rate increased from 59.4% in Q1 2024 to 75.4% in Q1 2025, marking both the largest nominal and relative increase studywide. The typical home value by the end of March 2025 sat at $440,237.
Homeownership decreased most sharply in Toledo, OH. The Toledo metro area saw homeownership drop over 13 points between 2024 and 2025, going from 82.5% to 69.2%. The typical home value was most recently estimated to be at $189,463, up about $10,000 year over year.
SmartAsset
Top 10 Metro Areas Where Homeownership Rates Are Highest
North Port-Bradenton-Sarasota, FL
Homeownership rate, Q1 2025: 82.3%
Typical home value, 2025: $430,197
Homeownership rate, Q1 2024: 83.2%
Typical home value, 2024: $461,635
Points change in homeownership: -0.9
Rochester, NY
Homeownership rate, Q1 2025: 81.9%
Typical home value, 2025: $254,501
Homeownership rate, Q1 2024: 75.5%
Typical home value, 2024: $236,481
Points change in homeownership: 6.4
Cape Coral-Fort Myers, FL
Homeownership rate, Q1 2025: 78.2%
Typical home value, 2025: $370,941
Homeownership rate, Q1 2024: 70.6%
Typical home value, 2024: $399,328
Points change in homeownership: 7.6
Albuquerque, NM
Homeownership rate, Q1 2025: 76.4%
Typical home value, 2025: $341,094
Homeownership rate, Q1 2024: 71.6%
Typical home value, 2024: $330,158
Points change in homeownership: 4.8
Charleston-North Charleston-Summerville, SC
Homeownership rate, Q1 2025: 75.4%
Typical home value, 2025: $440,237
Homeownership rate, Q1 2024: 59.4%
Typical home value, 2024: $432,819
Points change in homeownership: 16
Allentown-Bethlehem-Easton, PA-NJ
Homeownership rate, Q1 2025: 74.2%
Typical home value, 2025: $338,565
Homeownership rate, Q1 2024: 65.9%
Typical home value, 2024: $323,921
Points change in homeownership: 8.3
Columbia, SC
Homeownership rate, Q1 2025: 74%
Typical home value, 2025: $251,812
Homeownership rate, Q1 2024: 74.1%
Typical home value, 2024: $244,594
Points change in homeownership: -0.1
Syracuse, NY
Homeownership rate, Q1 2025: 73.4%
Typical home value, 2025: $234,605
Homeownership rate, Q1 2024: 64.2%
Typical home value, 2024: $215,502
Points change in homeownership: 9.2
Grand Rapids-Wyoming, MI
Homeownership rate, Q1 2025: 73.1%
Typical home value, 2025: $290,575
Homeownership rate, Q1 2024: 69.7%
Typical home value, 2024: $278,080
Points change in homeownership: 3.4
Cincinnati, OH-KY-IN
Homeownership rate, Q1 2025: 73.1%
Typical home value, 2025: $334,091
Homeownership rate, Q1 2024: 74.1%
Typical home value, 2024: $319,745
Points change in homeownership: -1
Top 10 Metro Areas Where Homeownership Rates Are Lowest
New York-Newark-Jersey City, NY-NJ-PA
Homeownership rate, Q1 2025: 47%
Typical home value, 2025: $685,225
Homeownership rate, Q1 2024: 48.6%
Typical home value, 2024: $648,616
Points change in homeownership: -1.6
Los Angeles-Long Beach-Anaheim, CA
Homeownership rate, Q1 2025: 49%
Typical home value, 2025: $978,226
Homeownership rate, Q1 2024: 48.6%
Typical home value, 2024: $940,792
Points change in homeownership: 0.4
San Francisco-Oakland-Hayward, CA
Homeownership rate, Q1 2025: 49%
Typical home value, 2025: $1,172,774
Homeownership rate, Q1 2024: 56.1%
Typical home value, 2024: $1,149,329
Points change in homeownership: -7.1
San Jose-Sunnyvale-Santa Clara, CA
Homeownership rate, Q1 2025: 50.5%
Typical home value, 2025: $1,692,599
Homeownership rate, Q1 2024: 51.5%
Typical home value, 2024: $1,578,660
Points change in homeownership: -1.0
San Diego-Carlsbad, CA
Homeownership rate, Q1 2025: 51.9%
Typical home value, 2025: $953,830
Homeownership rate, Q1 2024: 50%
Typical home value, 2024: $931,997
Points change in homeownership: 1.9
Las Vegas-Henderson-Paradise, NV
Homeownership rate, Q1 2025: 55.1%
Typical home value, 2025: $435,599
Homeownership rate, Q1 2024: 61.4%
Typical home value, 2024: $417,510
Points change in homeownership: -6.3
Raleigh, NC
Homeownership rate, Q1 2025: 56.2%
Typical home value, 2025: $443,772
Homeownership rate, Q1 2024: 63.6%
Typical home value, 2024: $443,381
Points change in homeownership: -7.4
Miami-Fort Lauderdale-West Palm Beach, FL
Homeownership rate, Q1 2025: 57.2%
Typical home value, 2025: $485,400
Homeownership rate, Q1 2024: 61.3%
Typical home value, 2024: $486,444
Points change in homeownership: -4.1
Fresno, CA
Homeownership rate, Q1 2025: 57.6%
Typical home value, 2025: $403,005
Homeownership rate, Q1 2024: 57.7%
Typical home value, 2024: $393,426
Points change in homeownership: -0.1
Austin-Round Rock, TX
Homeownership rate, Q1 2025: 57.7%
Typical home value, 2025: $449,181
Homeownership rate, Q1 2024: 56%
Typical home value, 2024: $467,357
Points change in homeownership: 1.7
Data and Methodology
For this SmartAsset study, data for homeownership rates across U.S. metro areas comes from the U.S. Census Bureau for Q1 2025 and Q1 2024. Data for typical home values comes from Zillow’s Home Value Index for all homes, smoothed and seasonally adjusted, for March 31, 2025 and March 31, 2024.


Reader Comments(0)