It’s that time of year when many households assess their budgets surrounding holiday parties, gifting and sales events like Black Friday and Cyber Monday. Local businesses, ecommerce businesses, and even governments collecting associated sales tax benefit from these end-of-year purchases. To accommodate the seasonal surge in spending, businesses must often plan ahead to account for increased traffic to stores and attractions during this time of year, making it important to understand the trajectory of holiday spending trends. Across the US, retail spending increased 7.75% between the holiday season in 2023 and 2024, but this figure varies greatly from state to state.
With this in mind, SmartAsset ranked U.S. states based on the year-over-year growth in retail spending across November and December 2024 and prior years, as well as each state’s preference for online versus in-store shopping.
Key Findings
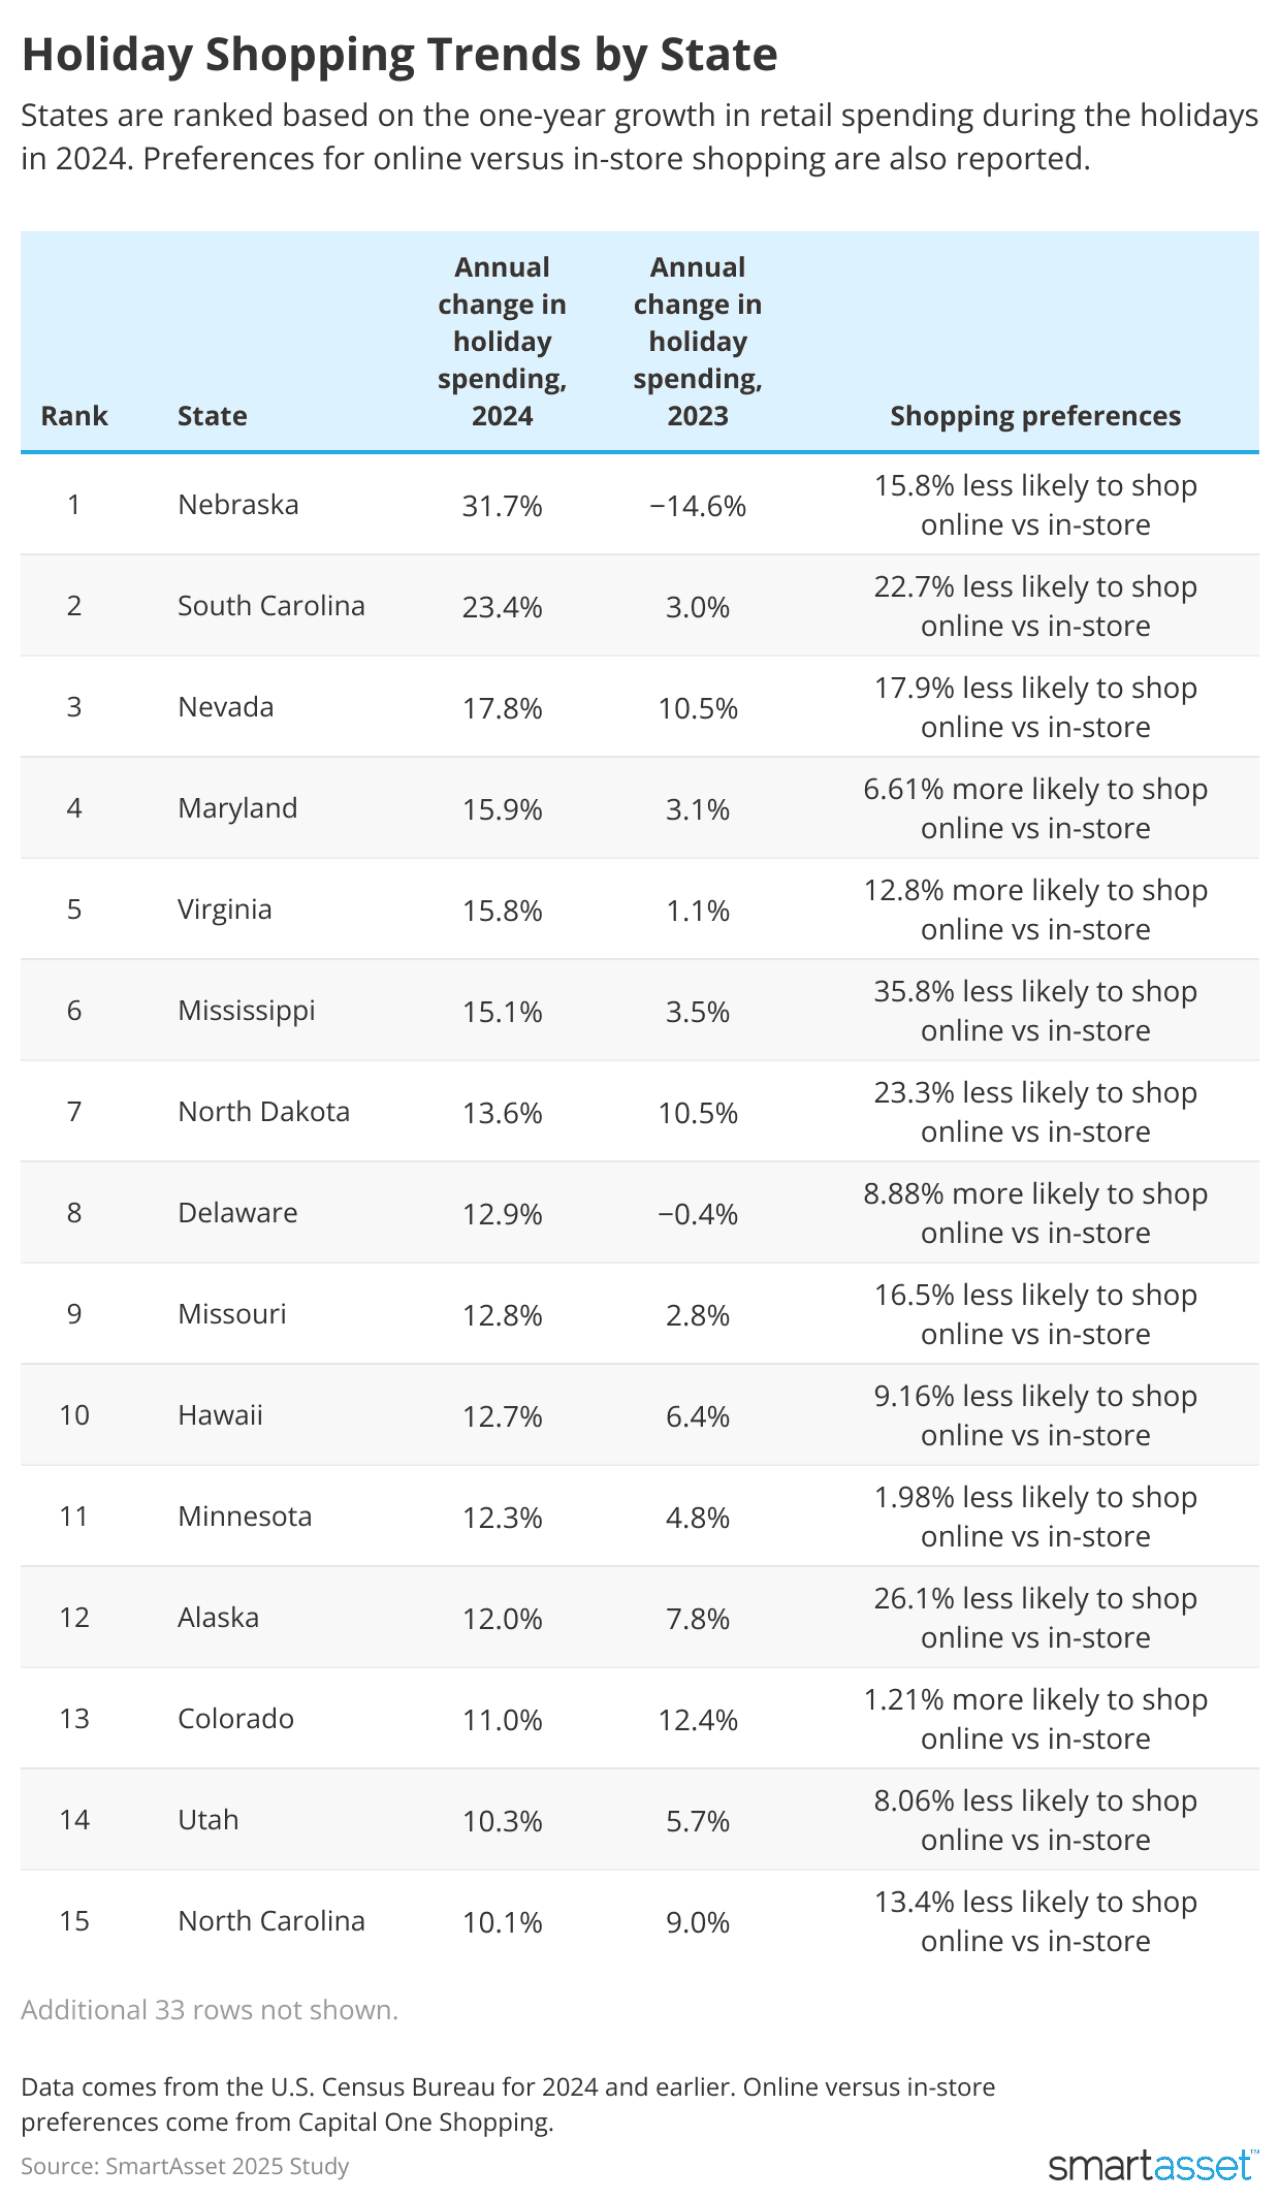
Holiday spending in Nebraska grew 32% year over year. Nebraska moved to the top spot for holiday spending growth between 2023 and 2024, after rebounding from last-place at -14.6% the year prior. South Carolina had the second-highest growth in holiday spending at 23.4%, while Nevada ranked third at 17.8%. Holiday spending in both South Carolina and Nevada has been on the upswing for four years running.
In three states, holiday spending declined in 2024. Vermont saw the biggest drop in holiday spending last year at -8.2%, following three subsequent years of single-digit decline in holiday spending. Wyoming (-3.0%) and New Jersey (-1.9%) also saw a decline in holiday spending last year, though it followed growth in both states the year prior.
Californians are most likely to shop online. Compared to the rest of the U.S., somebody in California is 29.9% more likely to shop online versus in-store. Washington has the second-highest preference for online shopping at 23.7% more likely, with Massachusetts ranking third in this metric at 20.8% more likely. Meanwhile, Wyoming has the highest preference for online shopping, with residents 38.7% less likely to shop online versus in-store.
SmartAsset
Holiday Shopping Trends by State
States are ranked based on the one-year change in retail spending during the holiday season in 2024 versus 2023.
Nebraska
Annual change in holiday shopping, 2024: 31.70%
Annual change in holiday shopping, 2023: -14.55%
Annual change in holiday shopping, 2022: 7.50%
Annual change in holiday shopping, 2021: 21.65%
Shopping preferences: 15.8% less likely to shop online vs in-store
South Carolina
2024: 23.35%
2023: 3.00%
2022: 2.45%
2021: 12.50%
Shopping preferences: 22.7% less likely to shop online vs in-store
Nevada
2024: 17.80%
2023: 10.50%
2022: 1.40%
2021: 15.20%
Shopping preferences: 17.9% less likely to shop online vs in-store
Maryland
2024: 15.90%
2023: 3.05%
2022: -2.65%
2021: 2.70%
Shopping preferences: 6.61% more likely to shop online vs in-store
Virginia
2024: 15.75%
2023: 1.05%
2022: -2.50%
2021: 7.35%
Shopping preferences: 12.8% more likely to shop online vs in-store
Mississippi
2024: 15.10%
2023: 3.45%
2022: -10.90%
2021: 19.55%
Shopping preferences: 35.8% less likely to shop online vs in-store
North Dakota
2024: 13.55%
2023: 10.50%
2022: -9.70%
2021: 16.85%
Shopping preferences: 23.3% less likely to shop online vs in-store
Delaware
2024: 12.85%
2023: -0.35%
2022: -7.90%
2021: 17.15%
Shopping preferences: 8.88% more likely to shop online vs in-store
Missouri
2024: 12.75%
2023: 2.75%
2022: 4.15%
2021: 13.05%
Shopping preferences: 16.5% less likely to shop online vs in-store
Hawai‘i
2024: 12.65%
2023: 6.40%
2022: -1.25%
2021: 6.45%
Shopping preferences: 9.16% less likely to shop online vs in-store
Minnesota
2024: 12.30%
2023: 4.75%
2022: -6.75%
2021: 15.15%
Shopping preferences: 1.98% less likely to shop online vs in-store
Alaska
2024: 12.00%
2023: 7.75%
2022: -6.90%
2021: 13.45%
Shopping preferences: 26.1% less likely to shop online vs in-store
Colorado
2024: 11.00%
2023: 12.35%
2022: -4.95%
2021: 14.05%
Shopping preferences: 1.21% more likely to shop online vs in-store
Utah
2024: 10.30%
2023: 5.65%
2022: -1.15%
2021: 14.85%
Shopping preferences: 8.06% less likely to shop online vs in-store
North Carolina
2024: 10.05%
2023: 8.95%
2022: -1.70%
2021: 16.85%
Shopping preferences: 13.4% less likely to shop online vs in-store
Montana
2024: 9.90%
2023: 4.55%
2022: -3.20%
2021: 17.65%
Shopping preferences: 29.9% less likely to shop online vs in-store
Michigan
2024: 9.75%
2023: 7.85%
2022: 0.50%
2021: 13.55%
Shopping preferences: 11.7% less likely to shop online vs in-store
Texas
2024: 9.65%
2023: 7.45%
2022: 1.75%
2021: 12.90%
Shopping preferences: 11.3% less likely to shop online vs in-store
Idaho
2024: 9.50%
2023: 8.05%
2022: -6.05%
2021: 23.65%
Shopping preferences: 19.8% less likely to shop online vs in-store
Kansas
2024: 9.45%
2023: 7.55%
2022: -4.20%
2021: 7.30%
Shopping preferences: 19.5% less likely to shop online vs in-store
Connecticut
2024: 9.15%
2023: 2.20%
2022: -2.70%
2021: 7.00%
Shopping preferences: 8.77% more likely to shop online vs in-store
Washington
2024: 9.10%
2023: 7.70%
2022: -1.80%
2021: 14.05%
Shopping preferences: 23.7% more likely to shop online vs in-store
South Dakota
2024: 7.75%
2023: 2.90%
2022: -17.60%
2021: 25.40%
Shopping preferences: 33.1% less likely to shop online vs in-store
Tennessee
2024: 6.65%
2023: -6.25%
2022: 0.50%
2021: 24.05%
Shopping preferences: 29.6% less likely to shop online vs in-store
Georgia
2024: 6.45%
2023: 4.40%
2022: 1.65%
2021: 13.70%
Shopping preferences: 5.45% less likely to shop online vs in-store
Oregon
2024: 6.25%
2023: 10.65%
2022: -1.80%
2021: 12.45%
Shopping preferences: 2.76% less likely to shop online vs in-store
Arizona
2024: 5.85%
2023: 3.85%
2022: 3.00%
2021: 9.10%
Shopping preferences: 6.58% less likely to shop online vs in-store
Pennsylvania
2024: 5.70%
2023: 3.10%
2022: 2.25%
2021: 10.65%
Shopping preferences: 2.84% more likely to shop online vs in-store
Louisiana
2024: 5.60%
2023: -3.30%
2022: 0.65%
2021: 12.70%
Shopping preferences: 33.9% less likely to shop online vs in-store
Oklahoma
2024: 5.40%
2023: -2.95%
2022: -0.65%
2021: 6.55%
Shopping preferences: 32.5% less likely to shop online vs in-store
Wisconsin
2024: 5.40%
2023: 11.55%
2022: 0.05%
2021: 12.30%
Shopping preferences: 4.31% less likely to shop online vs in-store
Maine
2024: 5.40%
2023: 4.10%
2022: -1.05%
2021: 12.85%
Shopping preferences: 4.69% less likely to shop online vs in-store
Massachusetts
2024: 5.25%
2023: 3.00%
2022: 10.00%
2021: 8.45%
Shopping preferences: 20.8% more likely to shop online vs in-store
Iowa
2024: 5.20%
2023: 6.50%
2022: -1.70%
2021: 17.10%
Shopping preferences: 14.5% less likely to shop online vs in-store
California
2024: 4.85%
2023: 8.35%
2022: 2.25%
2021: 8.55%
Shopping preferences: 29.9% more likely to shop online vs in-store
Indiana
2024: 4.75%
2023: 7.85%
2022: 0.80%
2021: 18.15%
Shopping preferences: 13.8% less likely to shop online vs in-store
Kentucky
2024: 4.55%
2023: 1.25%
2022: 1.45%
2021: 13.65%
Shopping preferences: 14.1% less likely to shop online vs in-store
Illinois
2024: 4.20%
2023: 7.85%
2022: 9.10%
2021: 16.65%
Shopping preferences: 2.84% more likely to shop online vs in-store
Ohio
2024: 3.95%
2023: 4.05%
2022: 0.00%
2021: 11.00%
Shopping preferences: 12.4% less likely to shop online vs in-store
New Mexico
2024: 3.60%
2023: 10.70%
2022: 3.80%
2021: 5.80%
Shopping preferences: 32.8% less likely to shop online vs in-store
New York
2024: 3.40%
2023: 10.95%
2022: 1.25%
2021: 5.05%
Shopping preferences: 6.61% more likely to shop online vs in-store
New Hampshire
2024: 3.25%
2023: -5.65%
2022: 4.55%
2021: 11.25%
Shopping preferences: 9.21% more likely to shop online vs in-store
Rhode Island
2024: 3.05%
2023: -0.45%
2022: -7.15%
2021: 8.60%
Shopping preferences: 10.5% more likely to shop online vs in-store
Arkansas
2024: 2.50%
2023: 6.30%
2022: 3.50%
2021: 18.30%
Shopping preferences: 33.3% less likely to shop online vs in-store
Alabama
2024: 1.60%
2023: 4.30%
2022: 1.75%
2021: 15.85%
Shopping preferences: 26.1% less likely to shop online vs in-store
New Jersey
2024: -1.90%
2023: 7.55%
2022: 7.80%
2021: 9.50%
Shopping preferences: 11.4% more likely to shop online vs in-store
Wyoming
2024: -3.00%
2023: 8.40%
2022: -6.10%
2021: 14.90%
Shopping preferences: 38.7% less likely to shop online vs in-store
Vermont
2024: -8.20%
2023: -3.05%
2022: -9.65%
2021: -4.35%
Shopping preferences: 7.32% less likely to shop online vs in-store
Data and Methodology
Data comes from the Monthly State Retail Sales (MSRS) from the U.S. Census Bureau. The weighted year-over-year change in retail spending in November and December of 2024 is compared to that of 2023. Relative changes in retail spending for holiday seasons in prior years are also considered. Data for every state except Florida and West Virginia was available.


Reader Comments(0)