Economic growth can change a city quickly. An influx of new residents and expanding business activity creates visible momentum, even as rapid change brings new strains. In recent years, some American cities stand out for attracting people, investment and development at a pace that sets them apart. Boomtown status does not mean growth benefits everyone equally, but it does reflect a city’s expanding economic capacity and the new opportunities that come with it.
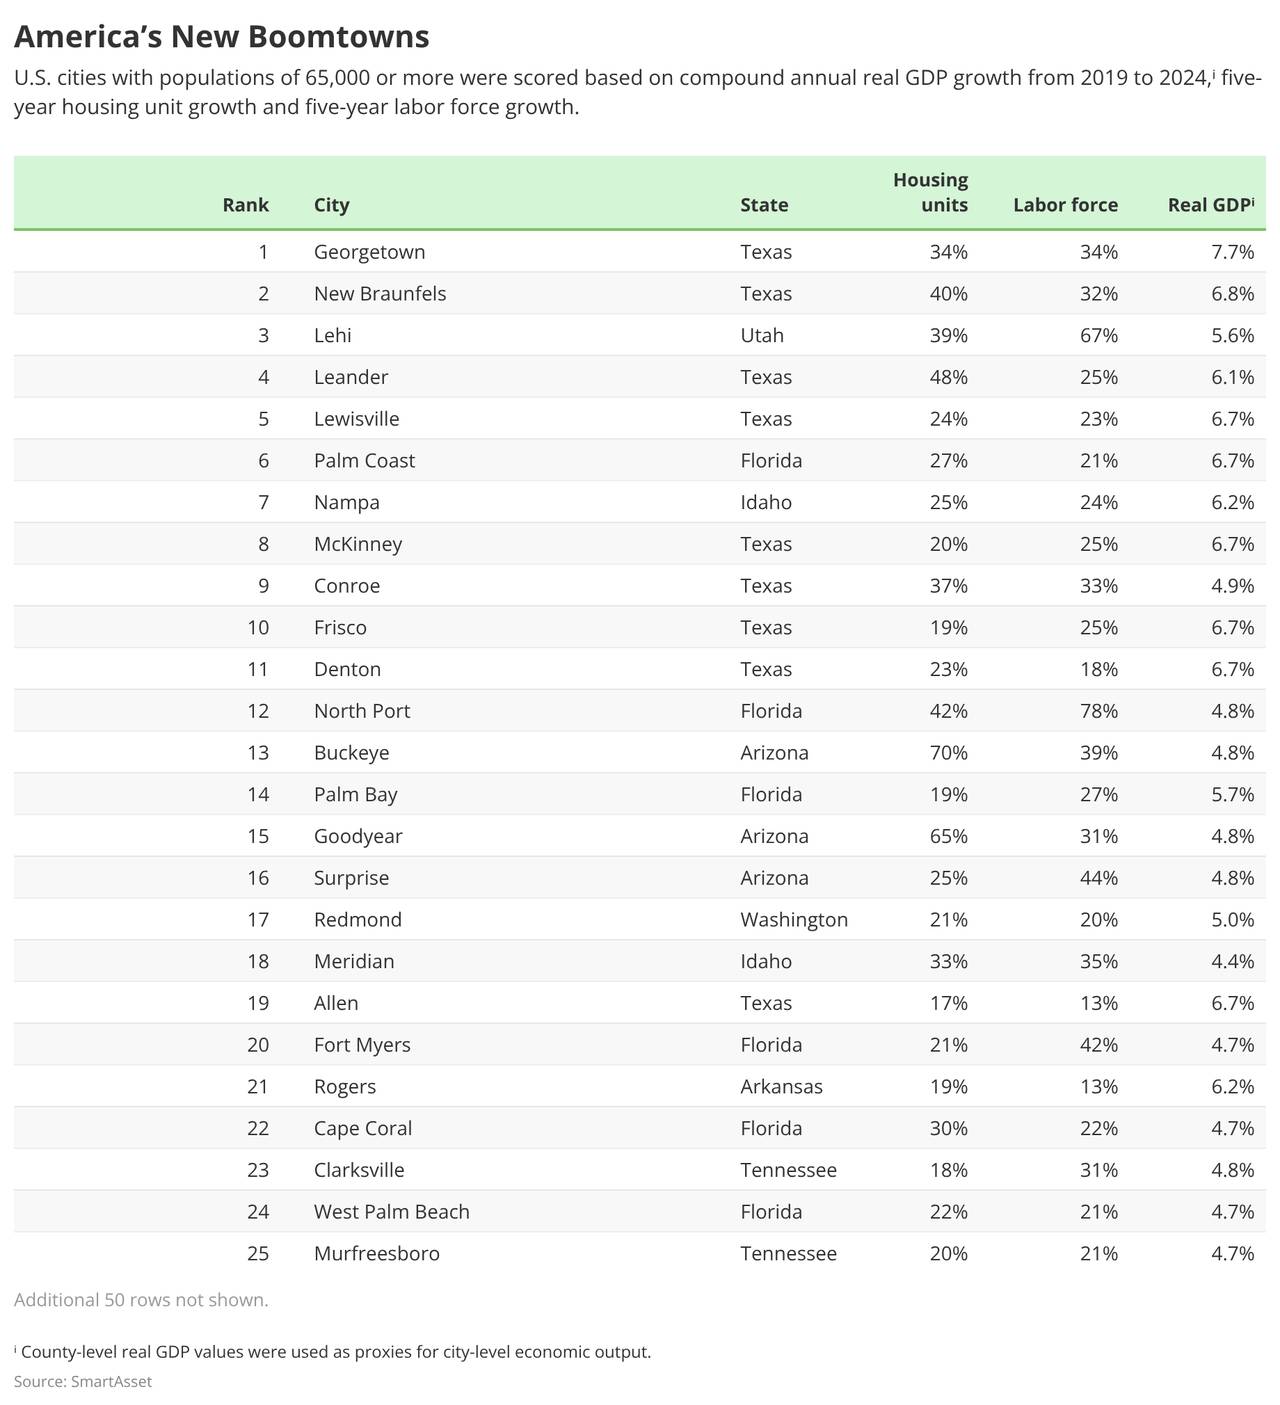
SmartAsset analyzed more than 400 U.S. cities with populations of 65,000 or more to identify places experiencing rapid growth. Each city received a composite score based on five-year changes in three factors: economic output, housing units and labor force size. The 75 highest-scoring cities represent America’s new boomtowns.
Key Findings
Florida is home to the most boomtowns in the country. Florida leads all states with 19 boomtowns, the most in the study. Texas follows closely with 18 boomtowns.
Two Texas cities top the list. Georgetown, Texas, ranks No. 1, followed by New Braunfels, Texas, at No. 2. The two Central Texas cities each saw five-year increases of more than 30% in labor force size and housing units, while county-level economic output grew at compound annual rates of 7.7% in Williamson County and 6.8% in Comal County.
Lehi, Utah, ranks No. 3. Lehi’s population has nearly doubled since 2010 as major employers, including Adobe, Microsoft and Texas Instruments, have established or expanded facilities in the city.
Only one boomtown in the Northeast. Portland, Maine, ranks No. 55 and is the only city in the Northeast to make the list, with investment tied to biotech and artificial intelligence helping it achieve boomtown status.
SmartAsset
Boomtowns Ranked
1. Georgetown, Texas
Housing unit increase: 34%
Labor force increase: 34%
Compound annual real GDP growth: 7.7%
2. New Braunfels, Texas
Housing unit increase: 40%
Labor force increase: 32%
Compound annual real GDP growth: 6.8%
3. Lehi, Utah
Housing unit increase: 39%
Labor force increase: 67%
Compound annual real GDP growth: 5.6%
4. Leander, Texas
Housing unit increase: 48%
Labor force increase: 25%
Compound annual real GDP growth: 6.1%
5. Lewisville, Texas
Housing unit increase: 24%
Labor force increase: 23%
Compound annual real GDP growth: 6.7%
6. Palm Coast, Florida
Housing unit increase: 27%
Labor force increase: 21%
Compound annual real GDP growth: 6.7%
7. Nampa, Idaho
Housing unit increase: 25%
Labor force increase: 24%
Compound annual real GDP growth: 6.2%
8. McKinney, Texas
Housing unit increase: 20%
Labor force increase: 25%
Compound annual real GDP growth: 6.7%
9. Conroe, Texas
Housing unit increase: 37%
Labor force increase: 33%
Compound annual real GDP growth: 4.9%
10. Frisco, Texas
Housing unit increase: 19%
Labor force increase: 25%
Compound annual real GDP growth: 6.7%
11. Denton, Texas
Housing unit increase: 23%
Labor force increase: 18%
Compound annual real GDP growth: 6.7%
12. North Port, Florida
Housing unit increase: 42%
Labor force increase: 78%
Compound annual real GDP growth: 4.8%
13. Buckeye, Arizona
Housing unit increase: 70%
Labor force increase: 39%
Compound annual real GDP growth: 4.8%
14. Palm Bay, Florida
Housing unit increase: 19%
Labor force increase: 27%
Compound annual real GDP growth: 5.7%
15. Goodyear, Arizona
Housing unit increase: 65%
Labor force increase: 31%
Compound annual real GDP growth: 4.8%
16. Surprise, Arizona
Housing unit increase: 25%
Labor force increase: 44%
Compound annual real GDP growth: 4.8%
17. Redmond, Washington
Housing unit increase: 21%
Labor force increase: 20%
Compound annual real GDP growth: 5.0%
18. Meridian, Idaho
Housing unit increase: 33%
Labor force increase: 35%
Compound annual real GDP growth: 4.4%
19. Allen, Texas
Housing unit increase: 17%
Labor force increase: 13%
Compound annual real GDP growth: 6.7%
20. Fort Myers, Florida
Housing unit increase: 21%
Labor force increase: 42%
Compound annual real GDP growth: 4.7%
21. Rogers, Arkansas
Housing unit increase: 19%
Labor force increase: 13%
Compound annual real GDP growth: 6.2%
22. Cape Coral, Florida
Housing unit increase: 30%
Labor force increase: 22%
Compound annual real GDP growth: 4.7%
23. Clarksville, Tennessee
Housing unit increase: 18%
Labor force increase: 31%
Compound annual real GDP growth: 4.8%
24. West Palm Beach, Florida
Housing unit increase: 22%
Labor force increase: 21%
Compound annual real GDP growth: 4.7%
25. Murfreesboro, Tennessee
Housing unit increase: 20%
Labor force increase: 21%
Compound annual real GDP growth: 4.7%
26. Doral, Florida
Housing unit increase: 51%
Labor force increase: 54%
Compound annual real GDP growth: 3.9%
27. Homestead, Florida
Housing unit increase: 47%
Labor force increase: 36%
Compound annual real GDP growth: 3.9%
28. Cedar Park, Texas
Housing unit increase: 19%
Labor force increase: 8%
Compound annual real GDP growth: 7.7%
29. Temple, Texas
Housing unit increase: 28%
Labor force increase: 33%
Compound annual real GDP growth: 3.9%
30. Avondale, Arizona
Housing unit increase: 22%
Labor force increase: 11%
Compound annual real GDP growth: 4.8%
31. Lauderhill, Florida
Housing unit increase: 20%
Labor force increase: 20%
Compound annual real GDP growth: 4.1%
32. Daytona Beach, Florida
Housing unit increase: 30%
Labor force increase: 16%
Compound annual real GDP growth: 3.9%
33. Tampa, Florida
Housing unit increase: 11%
Labor force increase: 15%
Compound annual real GDP growth: 5.0%
34. Fayetteville, Arkansas
Housing unit increase: 21%
Labor force increase: 20%
Compound annual real GDP growth: 3.9%
35. Chandler, Arizona
Housing unit increase: 13%
Labor force increase: 14%
Compound annual real GDP growth: 4.8%
36. Mansfield, Texas
Housing unit increase: 35%
Labor force increase: 34%
Compound annual real GDP growth: 3.3%
37. Austin, Texas
Housing unit increase: 17%
Labor force increase: 6%
Compound annual real GDP growth: 6.1%
38. Glendale, Arizona
Housing unit increase: 13%
Labor force increase: 13%
Compound annual real GDP growth: 4.8%
39. North Las Vegas, Nevada
Housing unit increase: 21%
Labor force increase: 24%
Compound annual real GDP growth: 3.5%
40. Jacksonville, Florida
Housing unit increase: 14%
Labor force increase: 15%
Compound annual real GDP growth: 4.4%
41. Deerfield Beach, Florida
Housing unit increase: 14%
Labor force increase: 20%
Compound annual real GDP growth: 4.1%
42. Bend, Oregon
Housing unit increase: 15%
Labor force increase: 12%
Compound annual real GDP growth: 4.6%
43. Round Rock, Texas
Housing unit increase: 19%
Labor force increase: 4%
Compound annual real GDP growth: 7.7%
44. Bowling Green, Kentucky
Housing unit increase: 16%
Labor force increase: 6%
Compound annual real GDP growth: 5.6%
45. Peoria, Arizona
Housing unit increase: 9%
Labor force increase: 20%
Compound annual real GDP growth: 4.8%
46. Baytown, Texas
Housing unit increase: 21%
Labor force increase: 17%
Compound annual real GDP growth: 3.7%
47. Auburn, Washington
Housing unit increase: 14%
Labor force increase: 8%
Compound annual real GDP growth: 5.0%
48. Huntsville, Alabama
Housing unit increase: 11%
Labor force increase: 20%
Compound annual real GDP growth: 4.3%
49. Lakeland, Florida
Housing unit increase: 10%
Labor force increase: 23%
Compound annual real GDP growth: 4.2%
50. Kissimmee, Florida
Housing unit increase: 5%
Labor force increase: 21%
Compound annual real GDP growth: 5.9%
51. Springdale, Arkansas
Housing unit increase: 16%
Labor force increase: 15%
Compound annual real GDP growth: 3.9%
52. Orlando, Florida
Housing unit increase: 9%
Labor force increase: 21%
Compound annual real GDP growth: 4.3%
53. Sparks, Nevada
Housing unit increase: 16%
Labor force increase: 14%
Compound annual real GDP growth: 3.8%
54. Portland, Maine
Housing unit increase: 15%
Labor force increase: 15%
Compound annual real GDP growth: 3.9%
55. Noblesville, Indiana
Housing unit increase: 16%
Labor force increase: 16%
Compound annual real GDP growth: 3.7%
56. Franklin, Tennessee
Housing unit increase: 11%
Labor force increase: 8%
Compound annual real GDP growth: 5.5%
57. Auburn, Alabama
Housing unit increase: 29%
Labor force increase: 32%
Compound annual real GDP growth: 2.5%
58. Tamarac, Florida
Housing unit increase: 9%
Labor force increase: 20%
Compound annual real GDP growth: 4.1%
59. Melbourne, Florida
Housing unit increase: 7%
Labor force increase: 10%
Compound annual real GDP growth: 5.7%
60. Pflugerville, Texas
Housing unit increase: 16%
Labor force increase: 2%
Compound annual real GDP growth: 6.1%
61. Pompano Beach, Florida
Housing unit increase: 15%
Labor force increase: 9%
Compound annual real GDP growth: 4.1%
62. South Jordan, Utah
Housing unit increase: 23%
Labor force increase: 11%
Compound annual real GDP growth: 3.4%
63. Henderson, Nevada
Housing unit increase: 13%
Labor force increase: 18%
Compound annual real GDP growth: 3.5%
64. Bellevue, Washington
Housing unit increase: 8%
Labor force increase: 9%
Compound annual real GDP growth: 5.0%
65. Menifee, California
Housing unit increase: 29%
Labor force increase: 45%
Compound annual real GDP growth: 2.4%
66. Reno, Nevada
Housing unit increase: 14%
Labor force increase: 11%
Compound annual real GDP growth: 3.8%
67. Seattle, Washington
Housing unit increase: 11%
Labor force increase: 6%
Compound annual real GDP growth: 5.0%
68. Knoxville, Tennessee
Housing unit increase: 6%
Labor force increase: 18%
Compound annual real GDP growth: 4.5%
69. Conway, Arkansas
Housing unit increase: 13%
Labor force increase: 18%
Compound annual real GDP growth: 3.3%
70. Rancho Cordova, California
Housing unit increase: 21%
Labor force increase: 17%
Compound annual real GDP growth: 2.5%
71. Brownsville, Texas
Housing unit increase: 14%
Labor force increase: 11%
Compound annual real GDP growth: 3.7%
72. Santa Clara, California
Housing unit increase: 11%
Labor force increase: 7%
Compound annual real GDP growth: 4.7%
73. Fort Worth, Texas
Housing unit increase: 15%
Labor force increase: 13%
Compound annual real GDP growth: 3.3%
74. Kirkland, Washington
Housing unit increase: 11%
Labor force increase: 4%
Compound annual real GDP growth: 5.0%
75. Sunnyvale, California
Housing unit increase: 11%
Labor force increase: 6%
Compound annual real GDP growth: 4.7%
Methodology
U.S. cities with populations of more than 65,000, based on 2024 U.S. Census Bureau American Community Survey (ACS) 1-year estimates, were analyzed. Each city was scored across three growth metrics: five-year labor force change, five-year housing unit change and county-level compound annual real GDP growth. Labor force and housing unit changes were calculated using 2019 and 2024 ACS data. Labor force includes residents ages 16 and older who are employed or actively seeking work. Real GDP growth was calculated using 2019 and 2024 Bureau of Economic Analysis data; county-level real GDP was used as a proxy for city-level economic output. Cities were assigned composite scores based on the three metrics and ranked accordingly. Source data providers are not affiliated with, and do not endorse or sponsor, this study or its findings.









Reader Comments(0)